
Analysis of climate change adaptation measures with the process-based crop model EPIC
We simulated using a crop process-based model called EPIC to test the adaptation potential of several management strategies including crop calendar options and irrigation fractions based on the field capacity under three climate scenarios (RCP 2.6, RCP 4.5 and RCP 8.5). Besides NELS, the simulation included also seven districts located in Southern Lower Saxony (SLS). The main goal was assessing the influence of irrigation and crop calendar on silage corn yield and water balance.
A restriction of this framework is the use of only one climate model, which showcases only one theoretical possible trajectory. Precipitation amounts for Harburg (in NELS) and Holzminden (in SLS) are 7000 m3 lower than the rest of the districts during the growing season, which explains the higher losses.
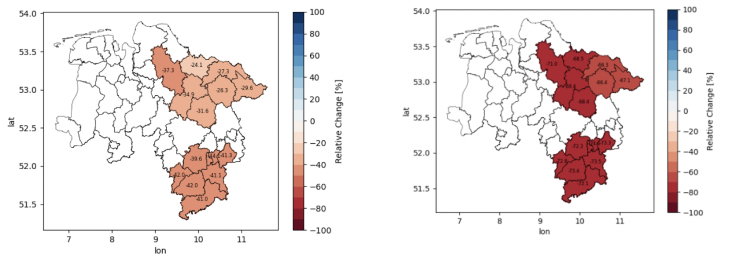
The following maps display the change in yield in reference to the yields for the period 1979-2018. In the left side is near future (2035-2065) and right is far future (2070-2100).
Wheat BAU Scenario RCP 8.5
Wheat 60% Field Capacity Irrigation and planting two months earlier and same harvesting
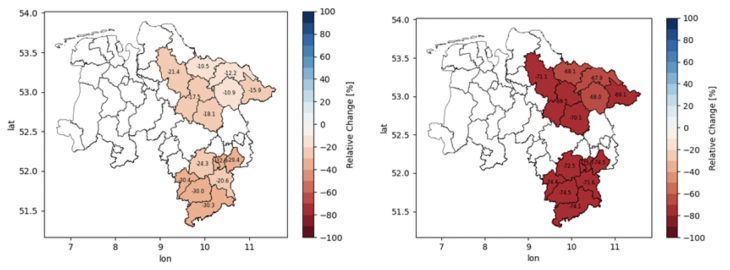
Fig. 3: Geographical winter wheat yield differences by applying 60% of field capacity water amount
Corn BAU Scenario RCP 8.5
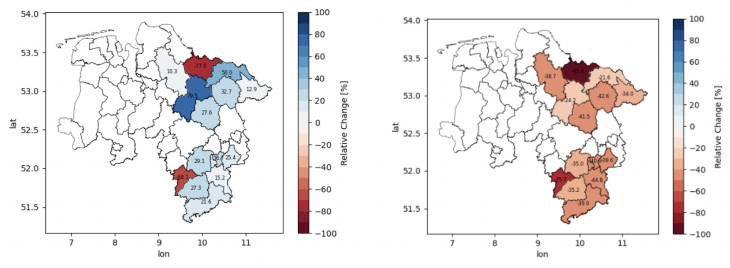
Corn 60% Field Capacity Irrigation and planting two months earlier and same harvesting
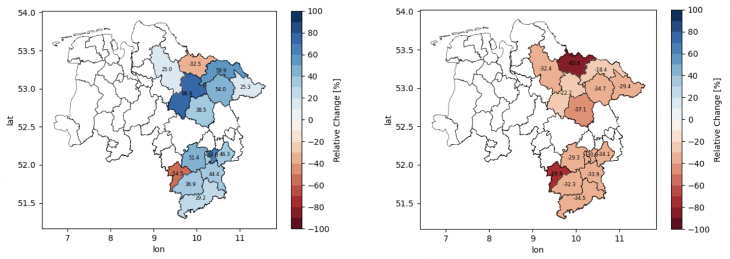
Fig. 4: Geographical corn yield differences by applying 60% of field capacity water amount
Corn and winter present different behaviors under the same management combination for both future periods for RCP 8.5. The model calculates the number of days in which the crop is stressed due to lack of water or deviations from optimum growth temperature. Figures 5 and 6 depict which of these two types of stresses significantly impact crop development. In the case of corn, we can observe that water stress plays a more prominent role. Thus, irrigation may mitigate these negative impacts. On the other hand, wheat is more affected by temperature stress compared to water stress. Adjusting its crop calendar is not sufficient to avoid yield losses, especially for 2070-2100, in which water stress increases slightly as well.
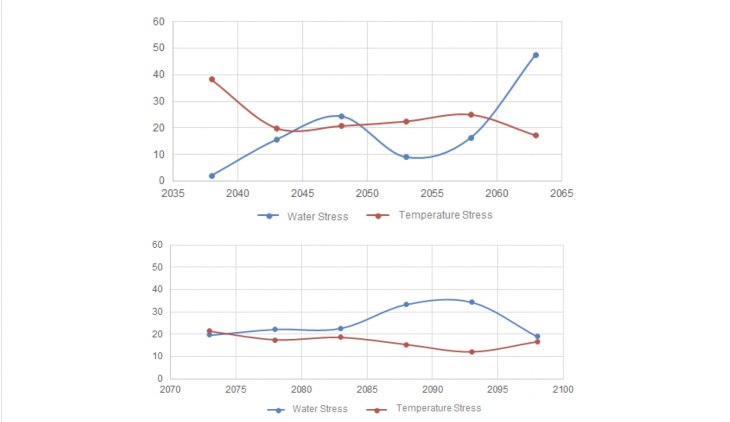
Fig 5: Stress days for corn. Blue line represents stress due to lack of water and red line due to temperature. Left side depicts the stress development for near future, and right side for far future.
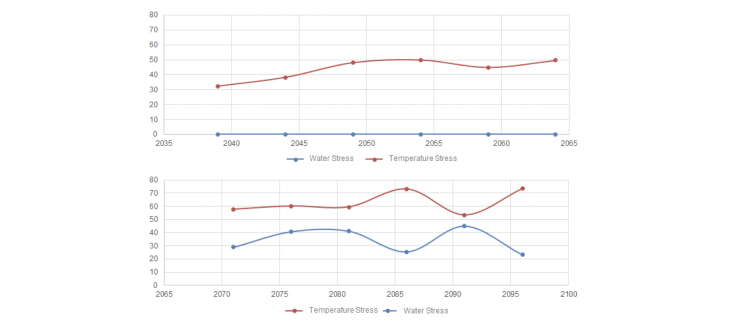
Fig 6: Stress days for wheat. Blue line represents stress due to lack of water and red line due to temperature. Left side depicts the stress development for near future, and right side for far future.
Peer-reviewed scientific papers:
- Egerer, S., Fajardo, A., Peichl, M., Rakovec, O., Samaniego, L., Schneider, U.: Limited potential of irrigation to prevent potato yield losses in Northern Germany under climate change (in preparation)
- Valencia Cortera, R., Egerer, S., and Máñez Costa, M.: Drought and water management under climate change in the German agricultural sector - a participatory system dynamics approach, Mitigation and Adaptation Strategies for Global Change (under review)
- Fajardo A. C., Egerer, S., Rasche, S., Doro, L., and Schneider, U.: Evaluating the viability of soybeans cultivation as an adaptation measure to climate change in Lower Saxony using EPIC, Science of the Total Environment (under review)
- Fajardo A. C., Egerer, S., Rasche, S., Doro, L., and Schneider, U.: Co-application of crop calendars and irrigation restricted potential in winter wheat and corn yield development under future climate: Case Study in Northern Germany (in preparation)
- Egerer, S., Valencia Cotera, R., Celliers, L., and Máñez Costa, M. (2021): A leverage points analysis of a qualitative system dynamics model for climate change adaptation in agriculture, Agricultural Systems, 189, 103052, https://doi.org/10.1016/j.agsy.2021.103052